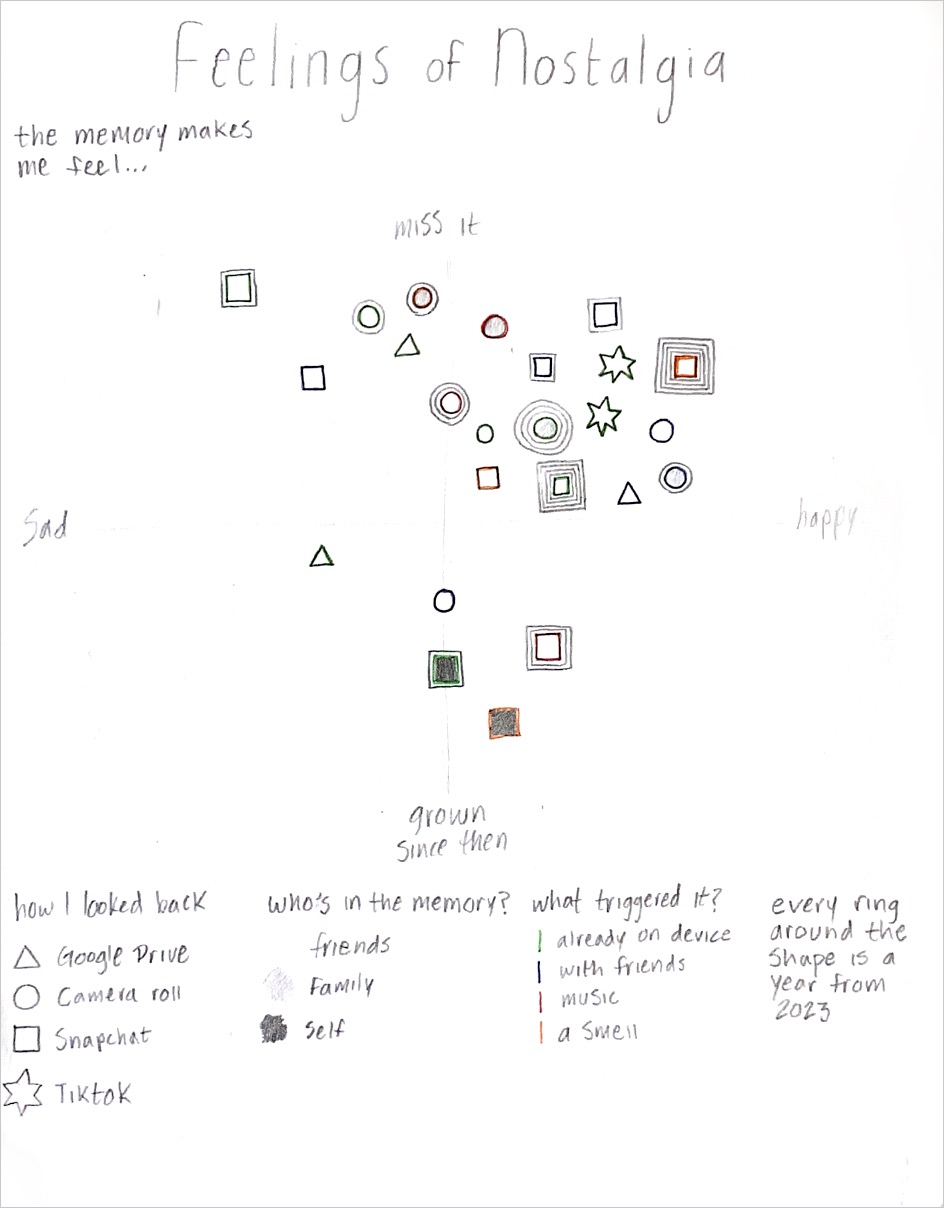
In response to a prompt to collect individual data, which was given in my fall sophomore studio—Design, Context, and Experience—I recorded information about specific memories and how I chose to relive them. I amassed a week’s worth of data and then developed rough drafts that visualized my findings. I continued iterating and assessing my approach, which led me to create an interesting and informative visualization. When presenting my “graph” to my peers, I discovered that little explanation was needed to read it, which was an important goal for me. Seeing connections between each of the data types I collected was interesting because it helped me recognize the interconnectedness of my feelings and actions. I’m glad I developed a robust set of data points because it enabled me to integrate different findings iton one cohesive design. I will carry forward my learnings from this project and apply them to information-dense projects in the future.
Below is a gallery of my project deliverables. Read more about my process here.