I joined a design team for the NC Museum of Natural Sciences’ Cretaceous Creatures project. I worked on the Duelling Dinosaurs exhibit, where real fossils from Montana are currently being uncovered and studied. I focused on exploring the Interactive Classroom Participants website to understand how students and teachers actually use it, what motivates them, and how the experience could be made clearer, more engaging, and more enjoyable.
Project Timeline:
20 weeks; October 2025-April 2026
Research Methods Employed
Surveys
SWOT Research
Comparative Market Research
A/B Testing
Roles Played
Comparative research
Usability testing
Ideation sketching
Concept iteration
Cross-discipline collaboration
Artifacts Designed
Research sketches
Inspiration boards
Market analysis/comparison
Interactive site design
1. Exploratory Research:
Market Research, Exploratory Research, Comparative Research
The design team is comprised of two subgroups—one focused on survey design, and the other on market research and design. Although my work focuses largely on market research and design efforts, I actively stay informed of the survey design efforts to gain insight into the entire research and design process.
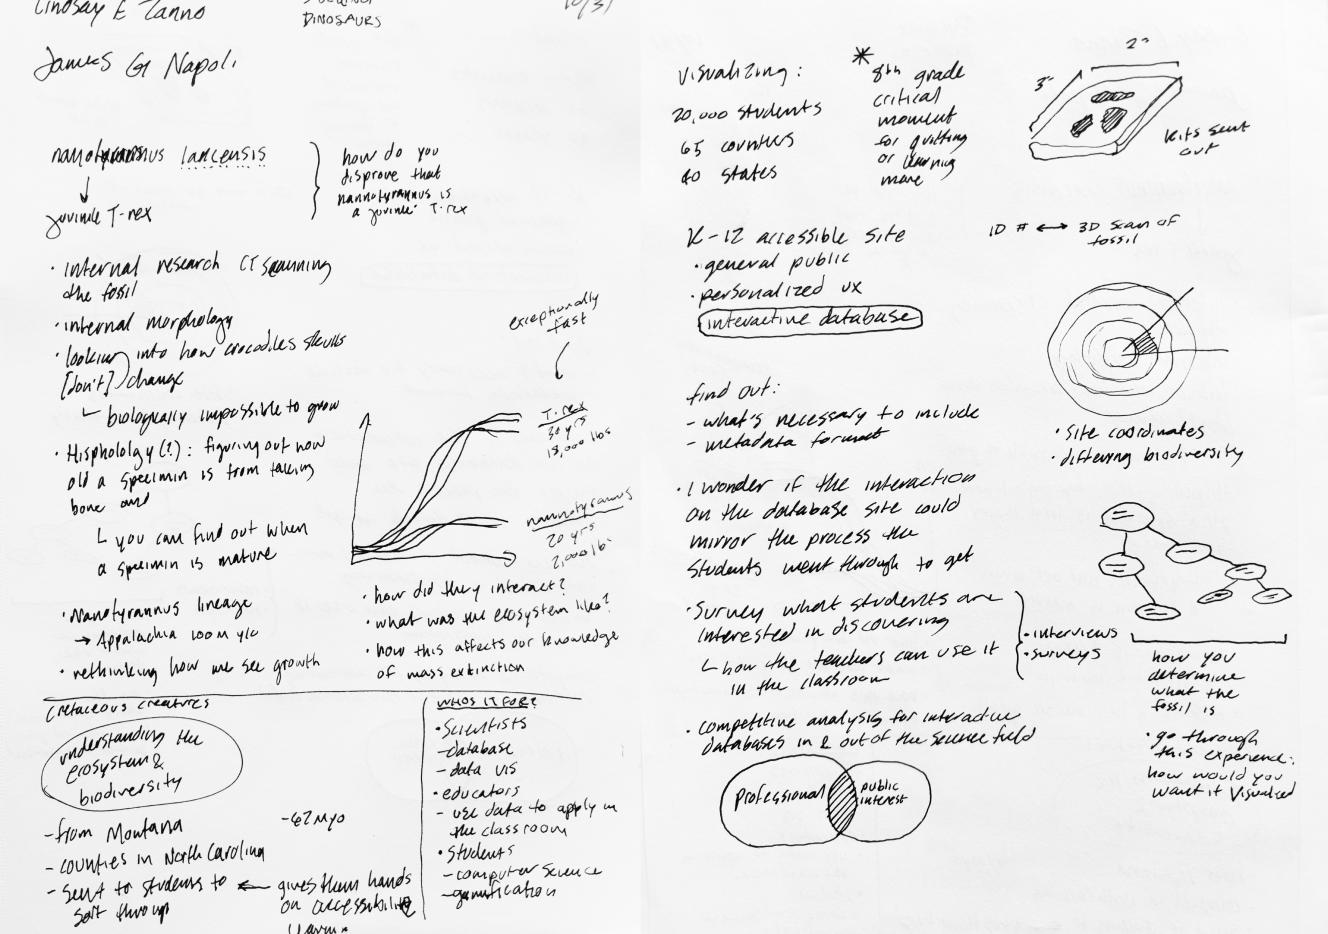
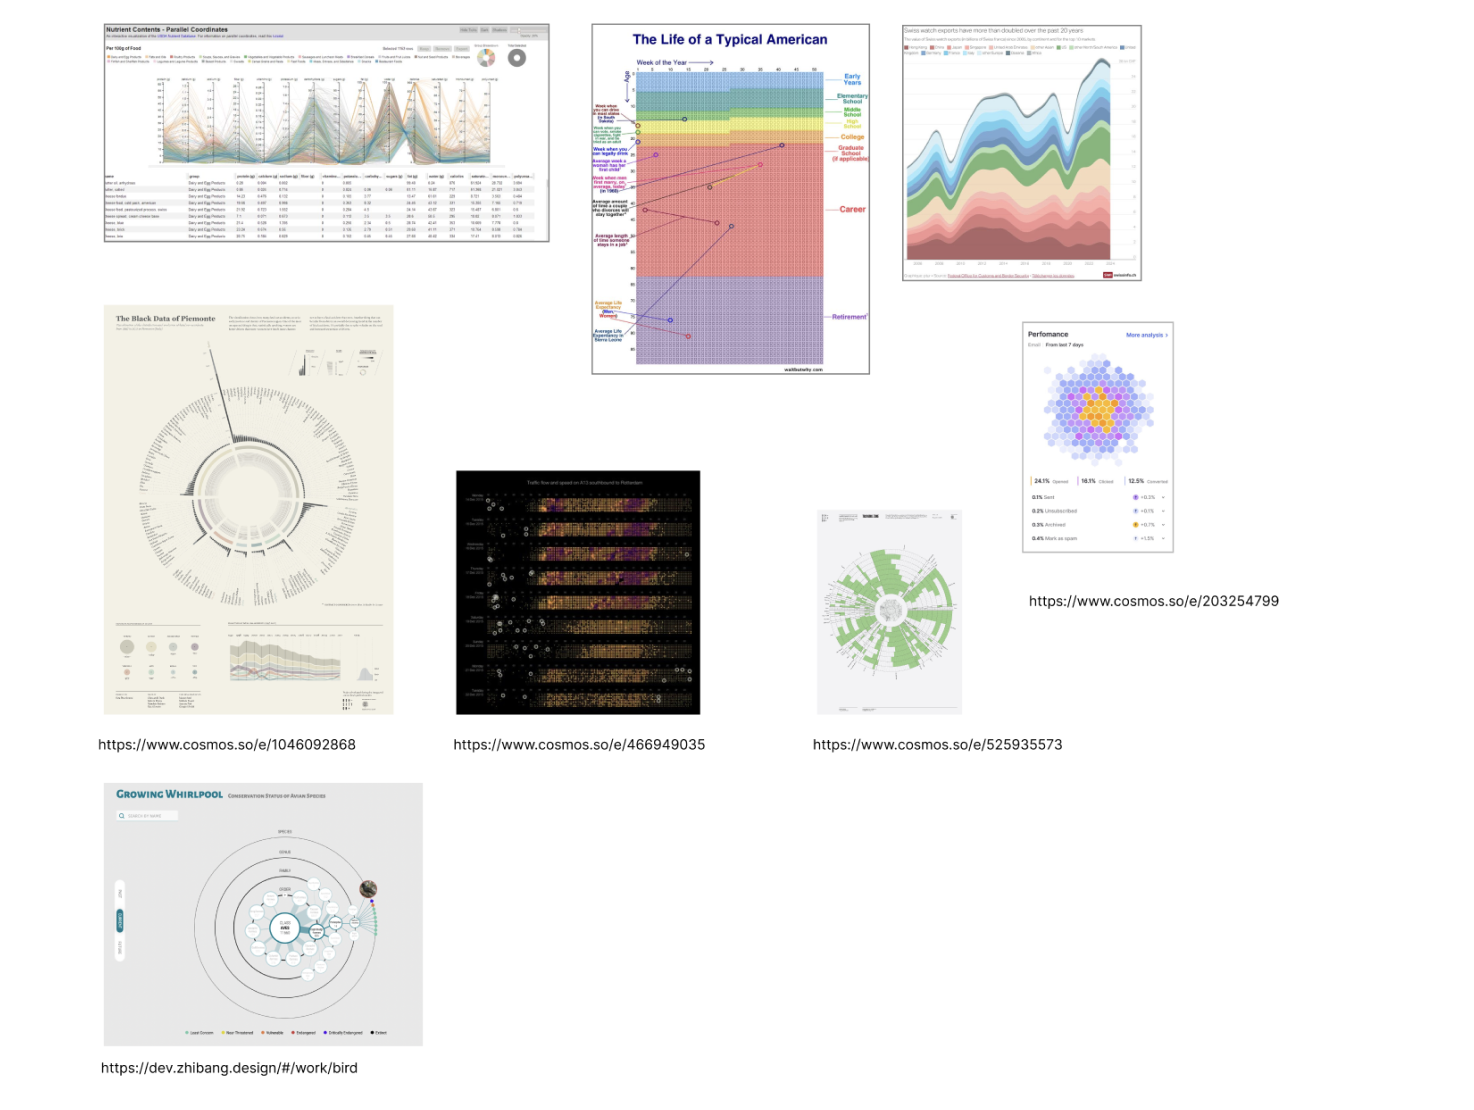
After meeting with the museum leader to gain background information and context related to the interactive site, I started conducted preliiminary market research to learn how data can be visualized to support different audiences. I investigated the affordances and limitations of various infographics in and outside of the science realm.
2. Secondary Research: Identifying Pinchpoints and Conducting Competitive Analysis
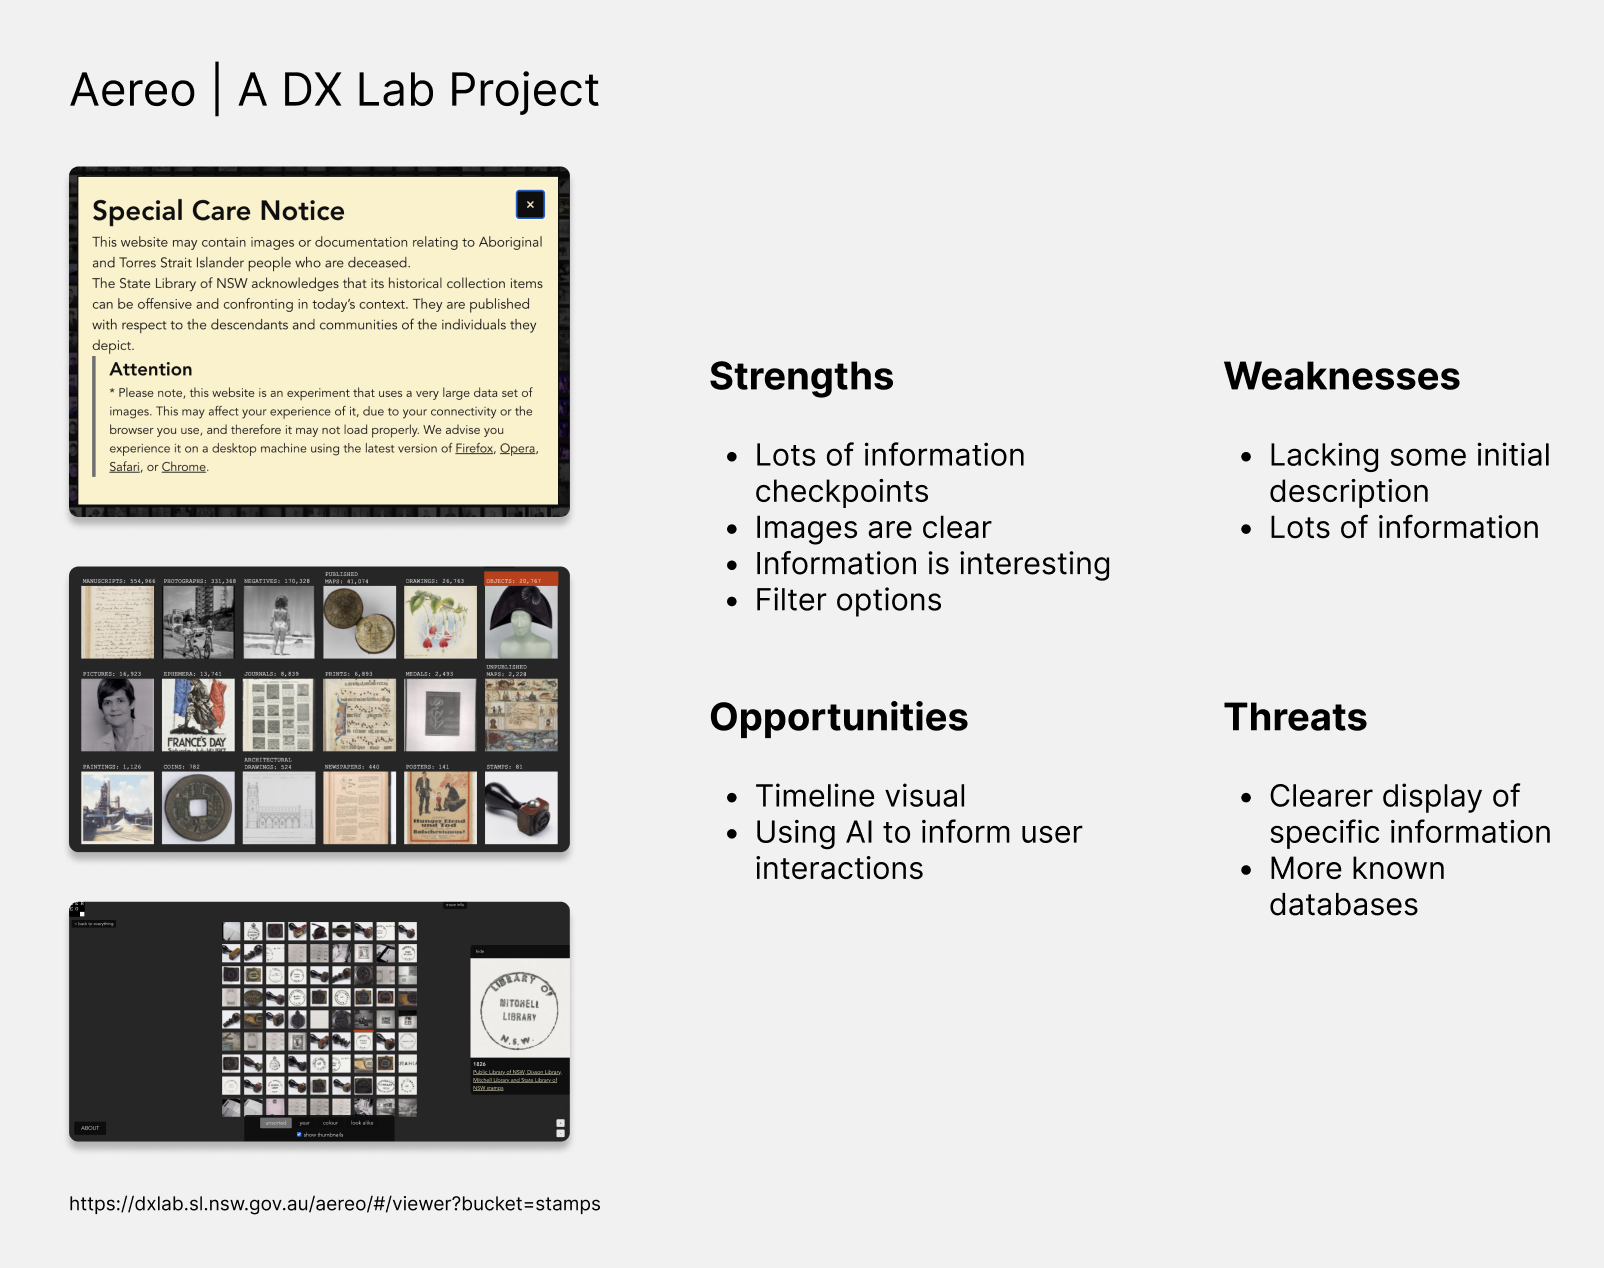
I conducted SWOT competitive analysis to understand the strengths and weaknesses of various interactive sites and infographics. I then compared several of them to better understand their functional similarities and differences. Through consistent meetings with the survey team, we compared our findings and identified useful patterns.
3. Generative Research:
Developing Personas, Establishing a User Journey Map, and Creating a User Story with Specific Touchpoints
We developed personas representing scientists, teachers, and students, capturing the needs and goals of everyone who would interact with the site. These personas helped define user expectations and informed the structure of the overall user journey.
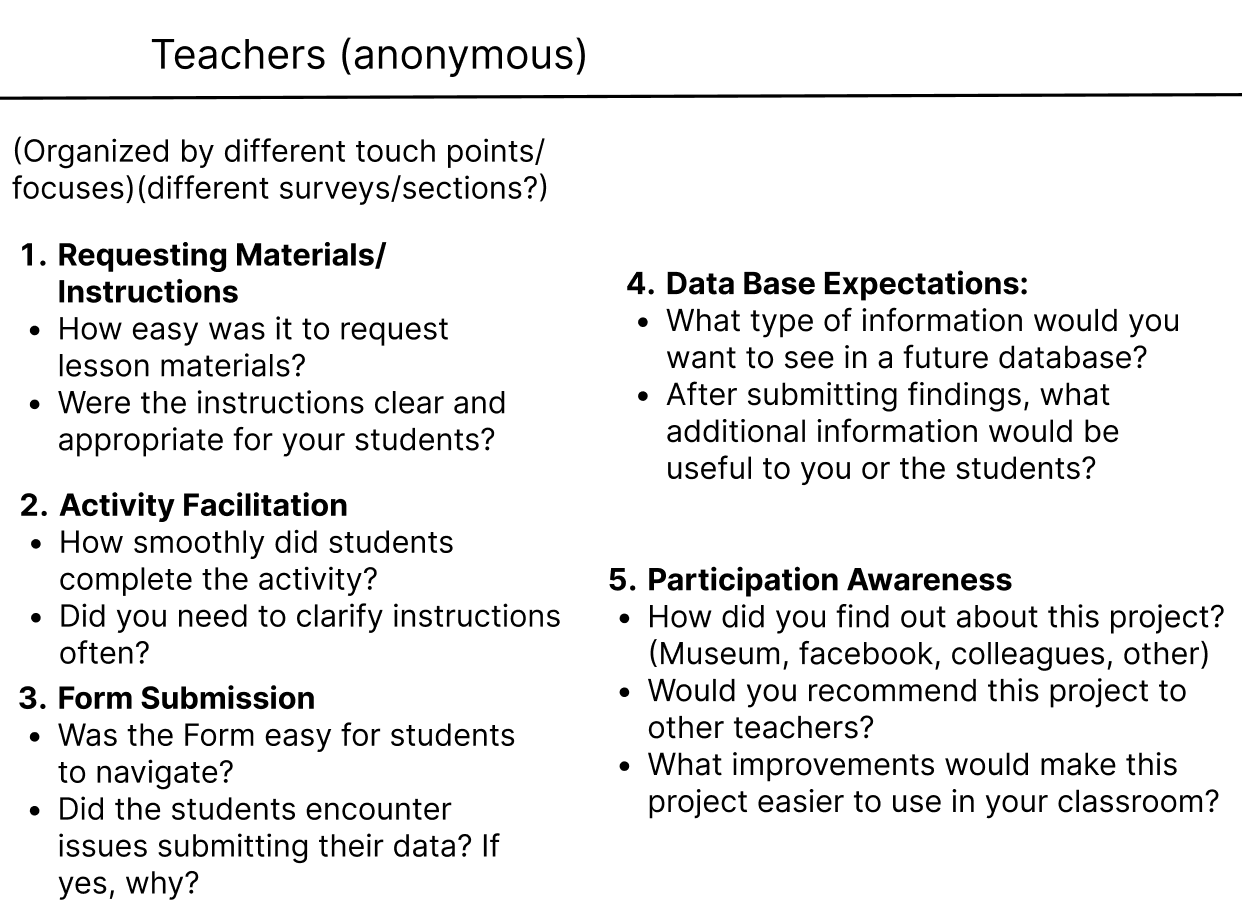
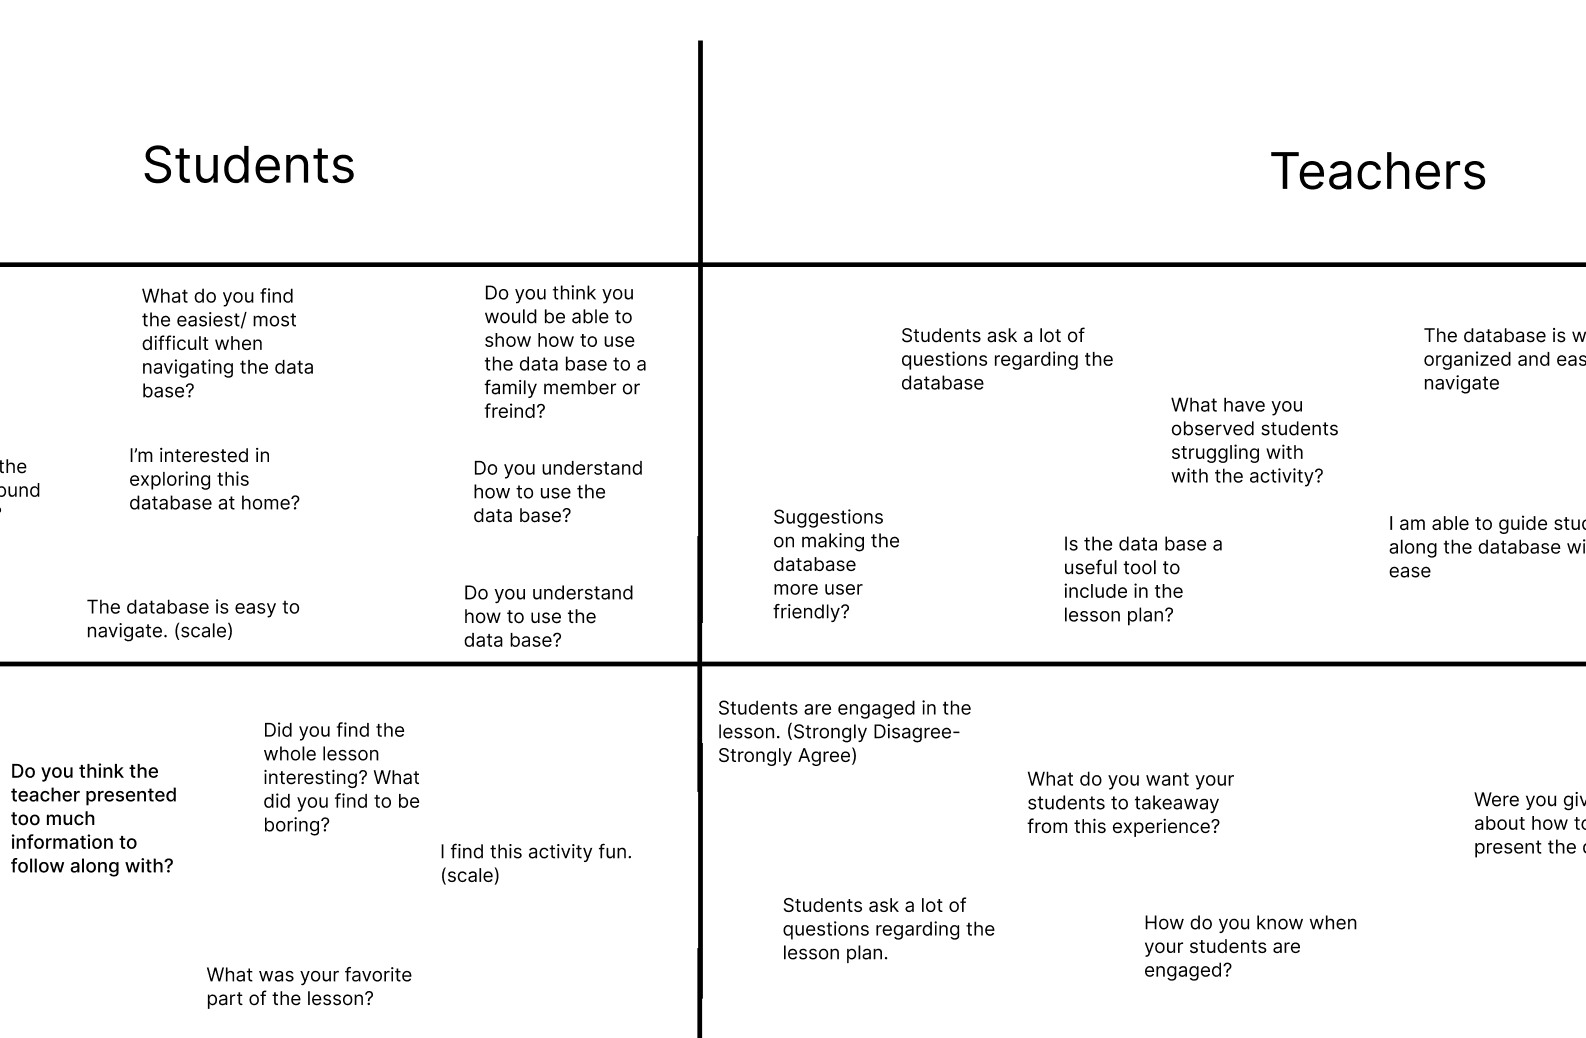
The survey team created a range of questions for inclusion in the various surveys that the museum planned to distribute. These questions were designed to gather meaningful insights from each audience group.
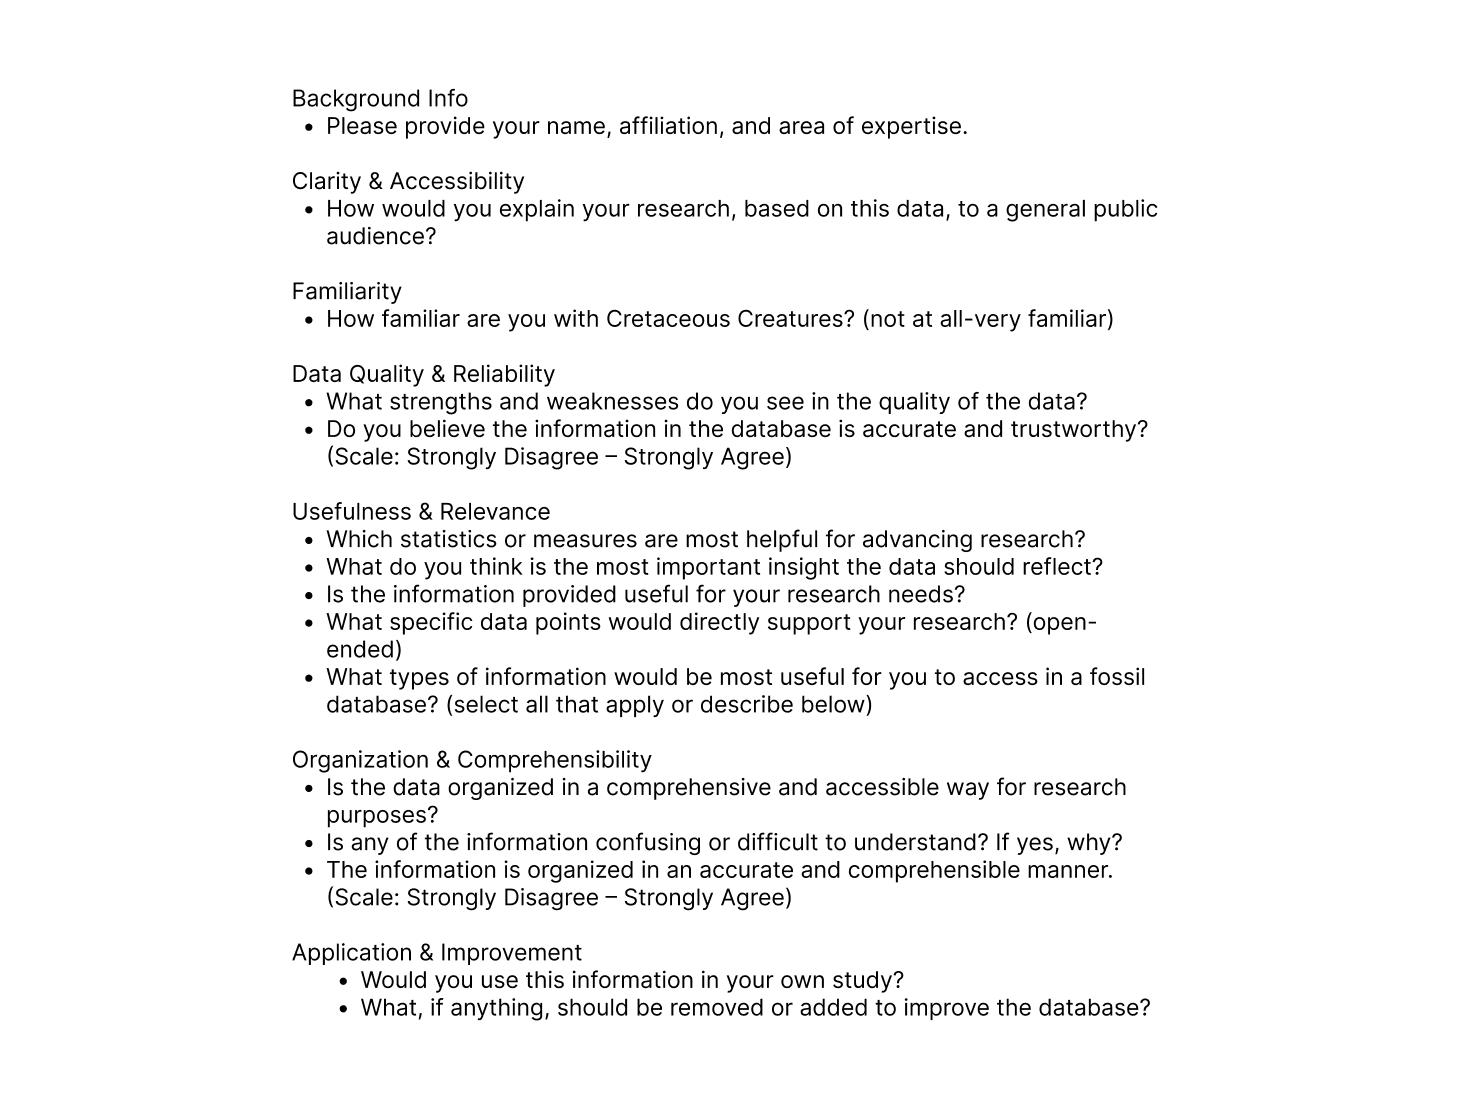
Initial broad topic ideas were refined into highly specific, targeted questions tailored to each user type. This process ensured the surveys addressed distinct user needs and produced actionable, relevant feedback for the project.
4. Prototyping:
Creating Low- and Mid-Fidelity Wireframes
Based on what I learned from my investigation of infographics, I sketched various ideas as wireframes for the interactive site. The proposals provide viewers with useful information in ways that are easy for them to use, while also being enjoyable.
5. Iterative Visual Design:
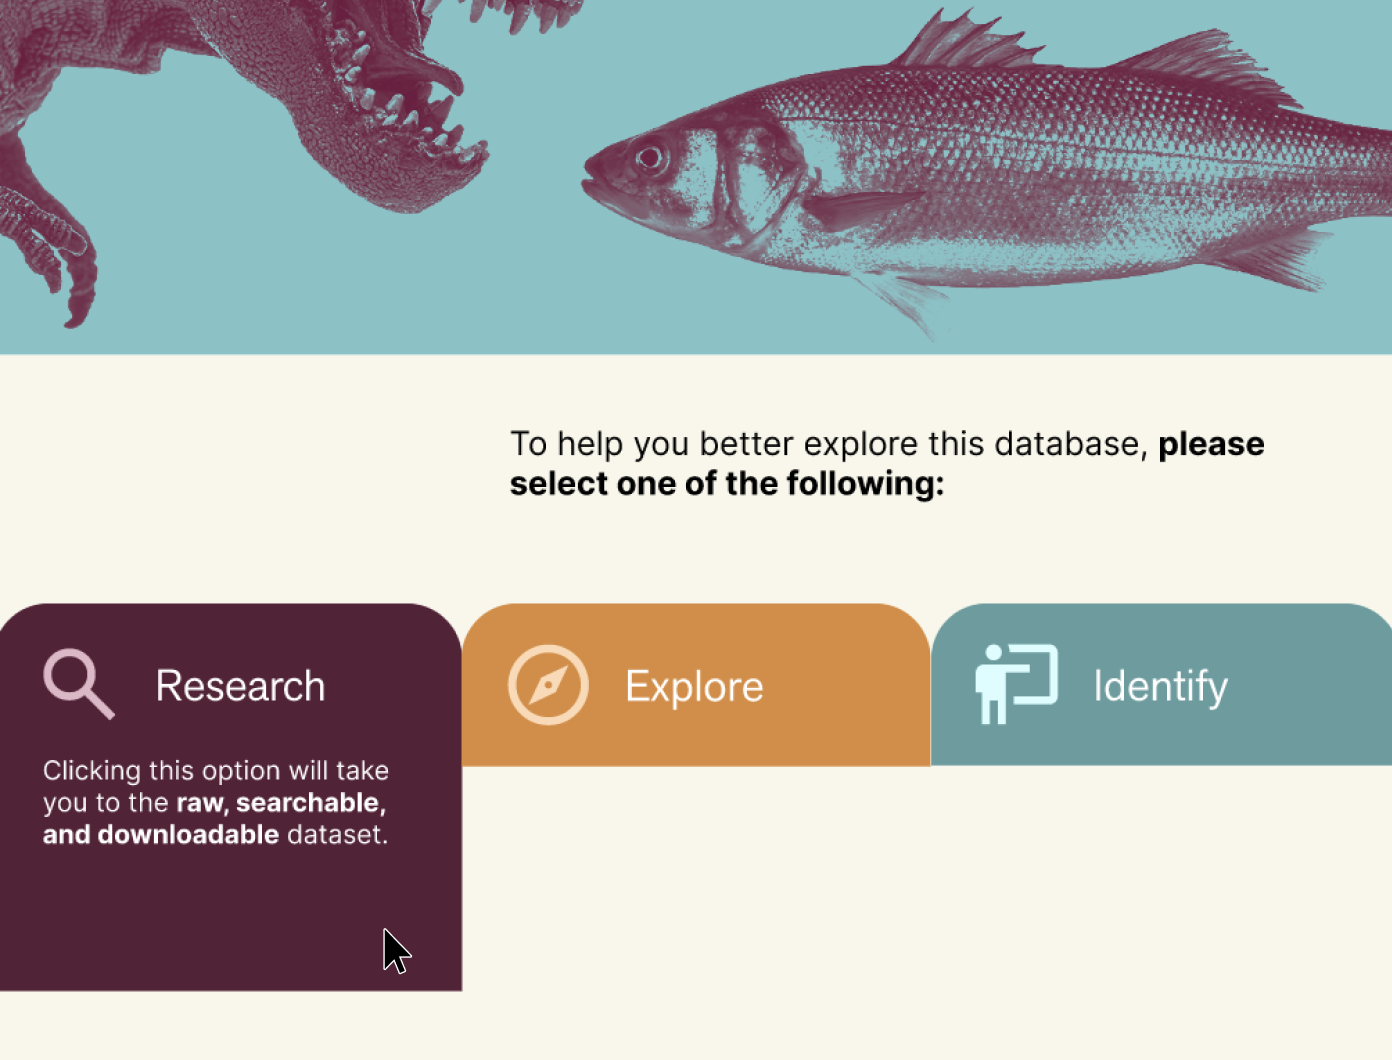
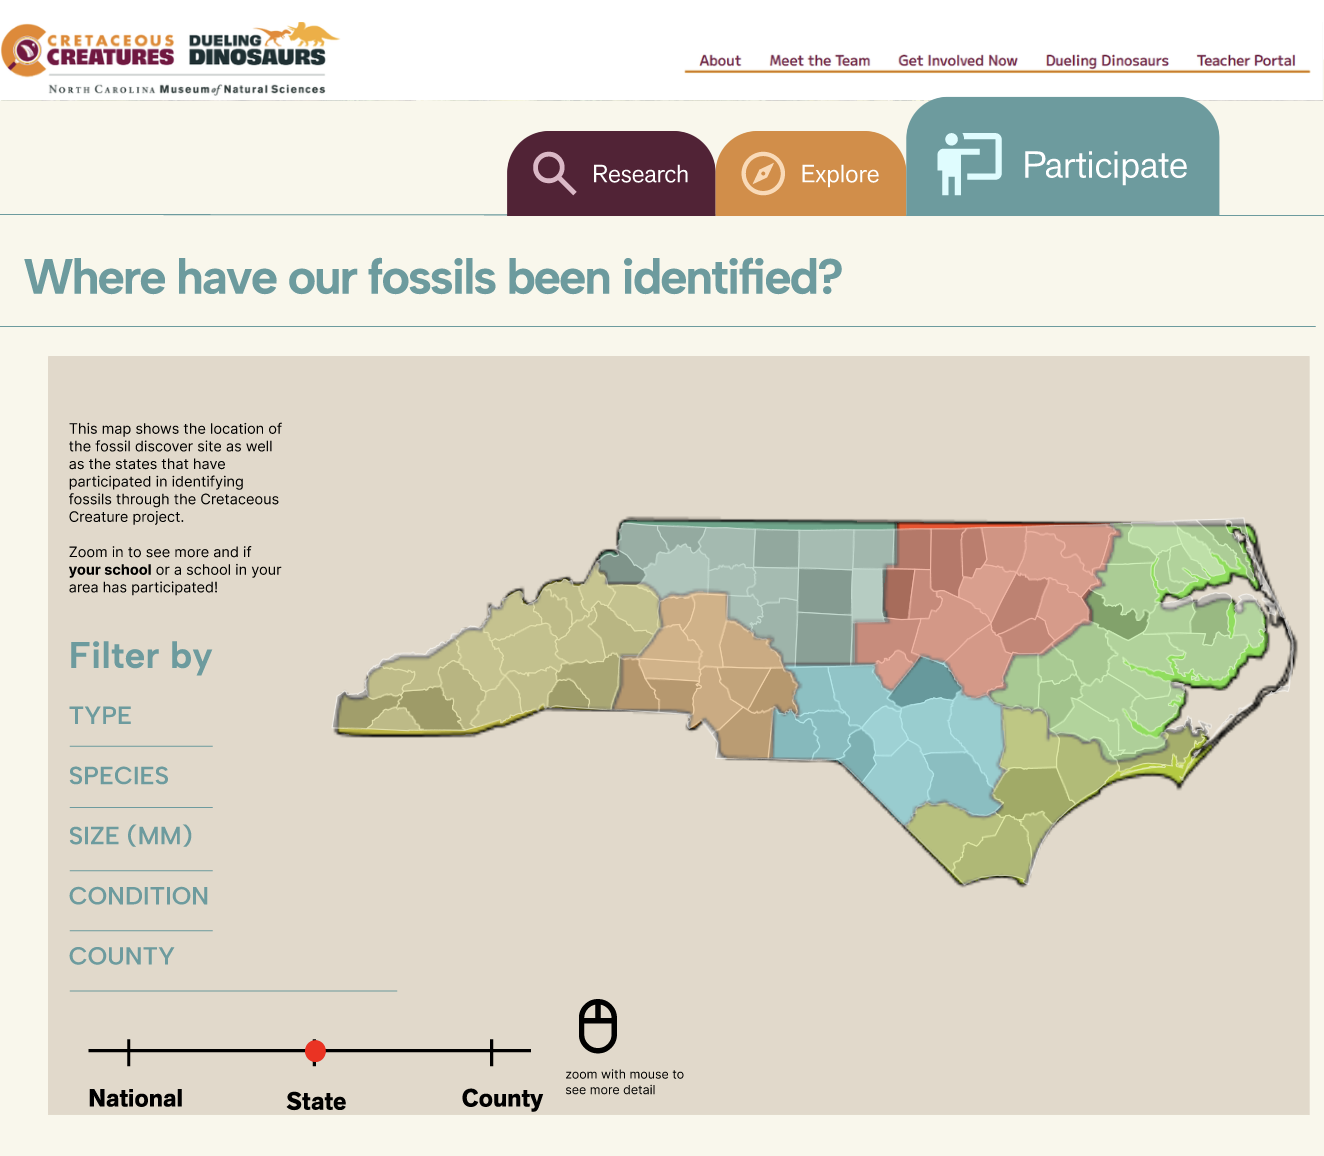
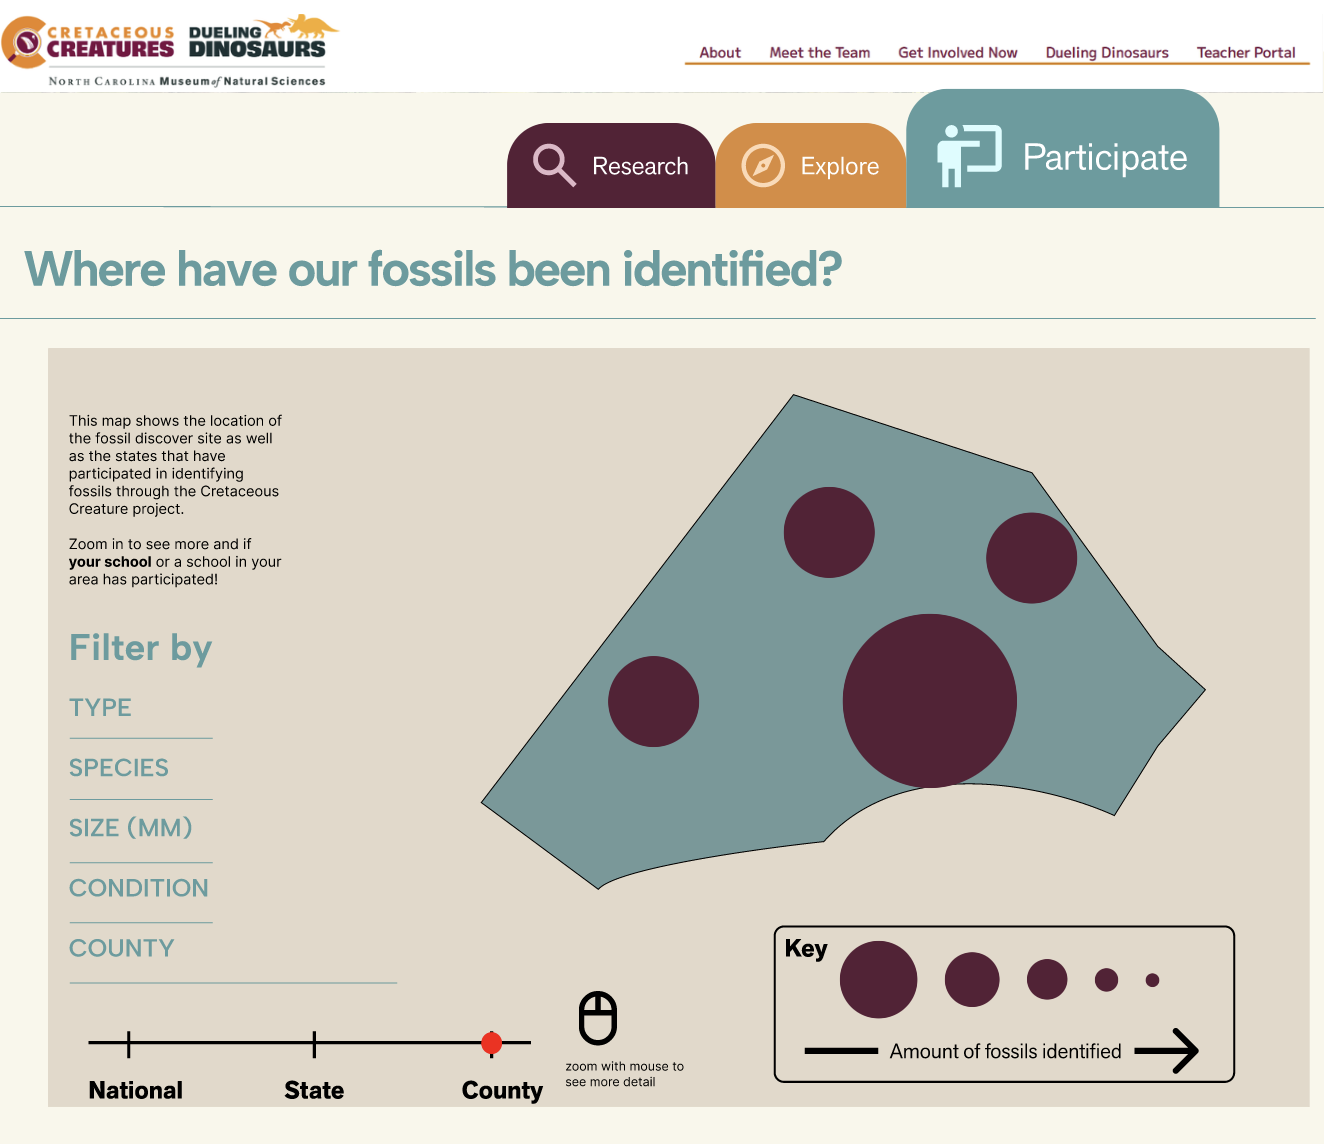
My team and I designed graphics to describe and depict the user journey throughout the museum’s Dueling Dinosaurs landing page. From the landing page, users can research the dataset, explore the microfossils found, or identify information for teaching.
6. Project Completion:
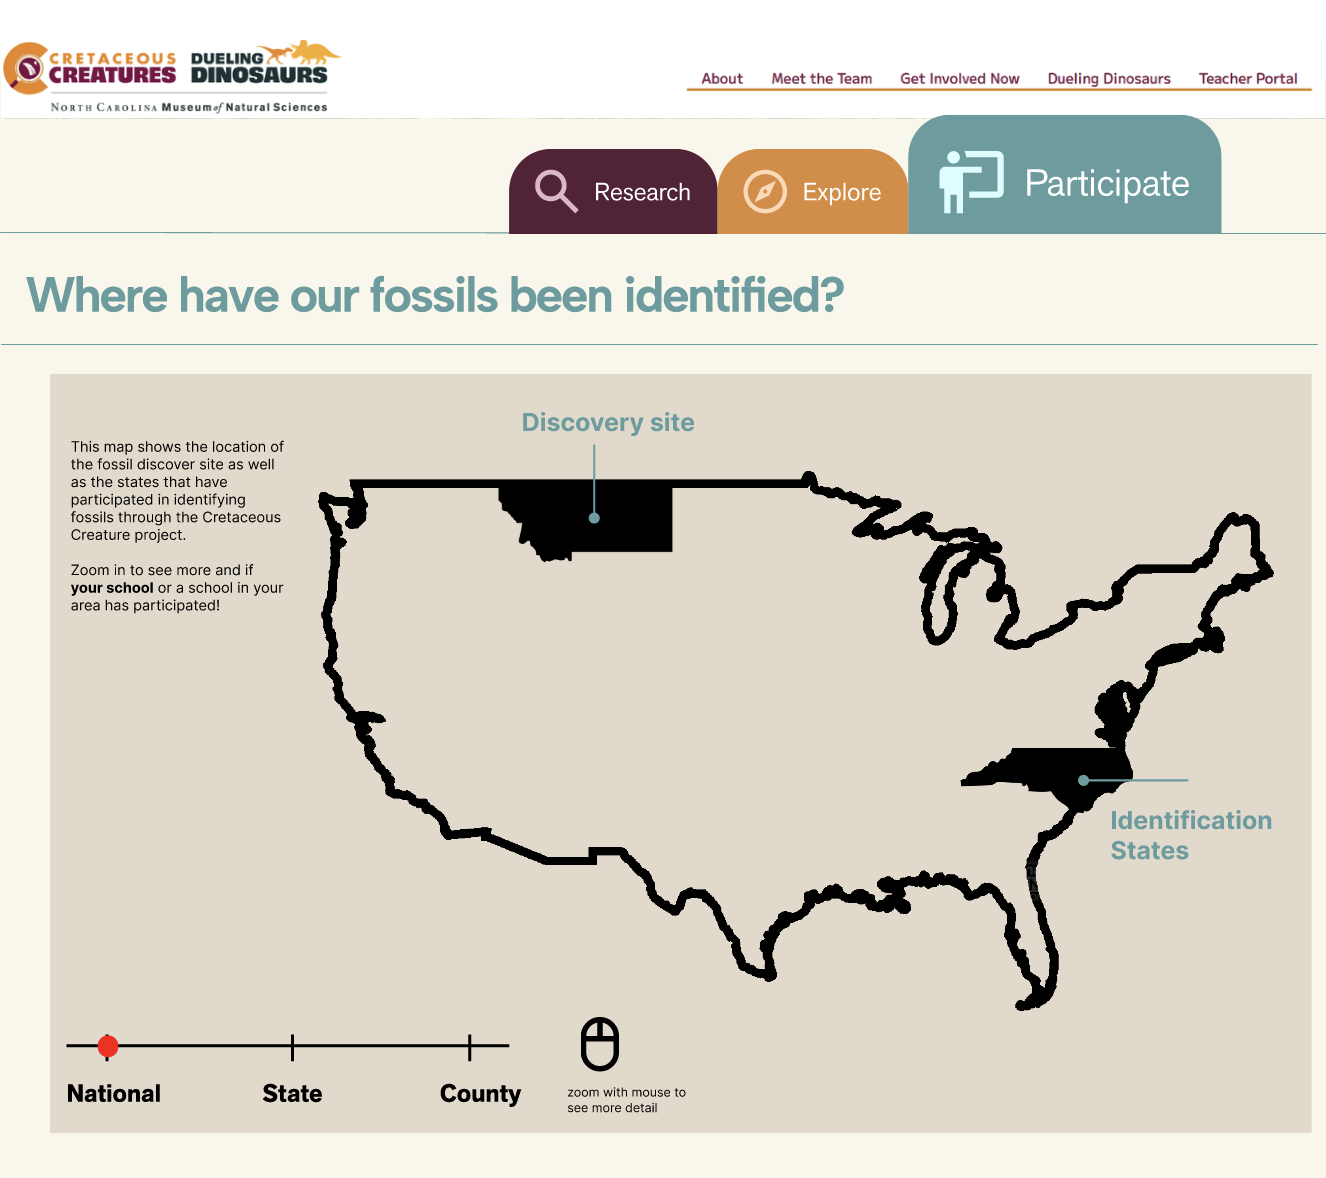
I designed the map portion of our project, displaying the national, state, and county levels of fossil findings.
Potential Outcomes:
This project has the potential to:
Help teachers engage students through hands-on activities
Provide useful information to scientists and researchers
Introduce new information to those exploring the Dueling Dinosaurs exhibition
Connect students with a concept that extend beyond the context of their schools
Challenges Tackled
I explored ways of visualizing fossil information that engage the general public, teach them about the topic, and are easy to access.
Learnings
The ease of some interactions varied based on one’s understanding of a specific topic. Therefore, since our primary audience approached the site with little information, we needed to design an interface that would be easy for them to navigate.
Next Steps
Engineers will work with the museum design team to develop the pages for the best interactions possible.
